
Back in 2011, I spent a couple of nights drawing the obstacle limitation surfaces for Brisbane Airport's main runway in SketchUp for Google Earth. It was mostly an exercise in visualisation and has been one of my most popular posts.
Fifteen years later, the surfaces themselves are being redrawn. Annex 14’s Amendment 18 replaces the OLS with two new families of surfaces, and I wanted to see what they actually look like. Not as a cross-section in a PDF, but over the runway, in 3D, next to the surfaces we’ve been working with for decades.
So, with the help of our trusty friend, AI, I built a tool. And this time, it isn't just Brisbane, it’s nearly anywhere you could want. And isn’t just a model, it’s fully interactive and really quite instructive.
What's Changing?
If you haven't been following along, here is the short version. From 21 November 2030*, the familiar OLS gives way to two sets of surfaces with two very different jobs.
Obstacle Free Surfaces (OFS) protect the airspace close to the runway, where aircraft land and go around. These are the “hard” surfaces. New objects are prohibited, apart from required navaids and safety equipment that is frangible and low. Existing objects should be removed, and those that can't be are only permitted after an aeronautical study.
Obstacle Evaluation Surfaces (OES) cover a wider area and come with significant optionality. They change depending on whether aircraft perform circling approaches, or straight-in instrument approaches, or precision approaches, or instrument departures and so on. Penetrating an OES doesn't automatically make an object unacceptable. It triggers an aeronautical study.
The other big shift is what drives the dimensions. The legacy OLS is based on the critical aircraft’s code number and the type of approach guidance provided. The new surfaces hang off the Aeroplane Design Group (ADG), a combination of wingspan with approach speed (Vat). It’s not a clean map, so knowing your critical aircraft is essential for viewing the impact of these changes.
The Tool
The visualiser is capable of drawing both regimes for any of about 12,000 paved runways at 9,800 airports worldwide. Here's how it works:
Pick an airport and runway. Search by ICAO code or name. Runway ends, elevations, width and displaced thresholds come from OurAirports, and every value can be overridden (with AIP AD 2.12 as the obvious reference).
Set the critical aeroplane. Enter the aeroplane reference field length, wingspan and Vat, or start from a preset. The tool works out the code number, code letter, ADG and the matching legacy Table 4-1 column, and shows you the band each one came from.
Set the operation. Approach type, circling or visual circuits, instrument departures, MTOM above or below 5,700 kg, and the Code F digital go-around steering flag.
Compare. View legacy only, new only, both overlaid, or the difference.
Difference mode is the one I find most useful. It compares the lowest legacy surface with the lowest new surface across a grid and colours each cell by how much the new regime is lower (more restrictive) or higher. Hover over a cell and you get both heights and which surface governs each.
Click on any surface and the details panel gives you the clause, table and column, obligation, obstacle rule and the dimensions, including any footnote that has changed a value (and which one). The whole configuration lives in the page link, so you can send someone exactly what you are looking at.
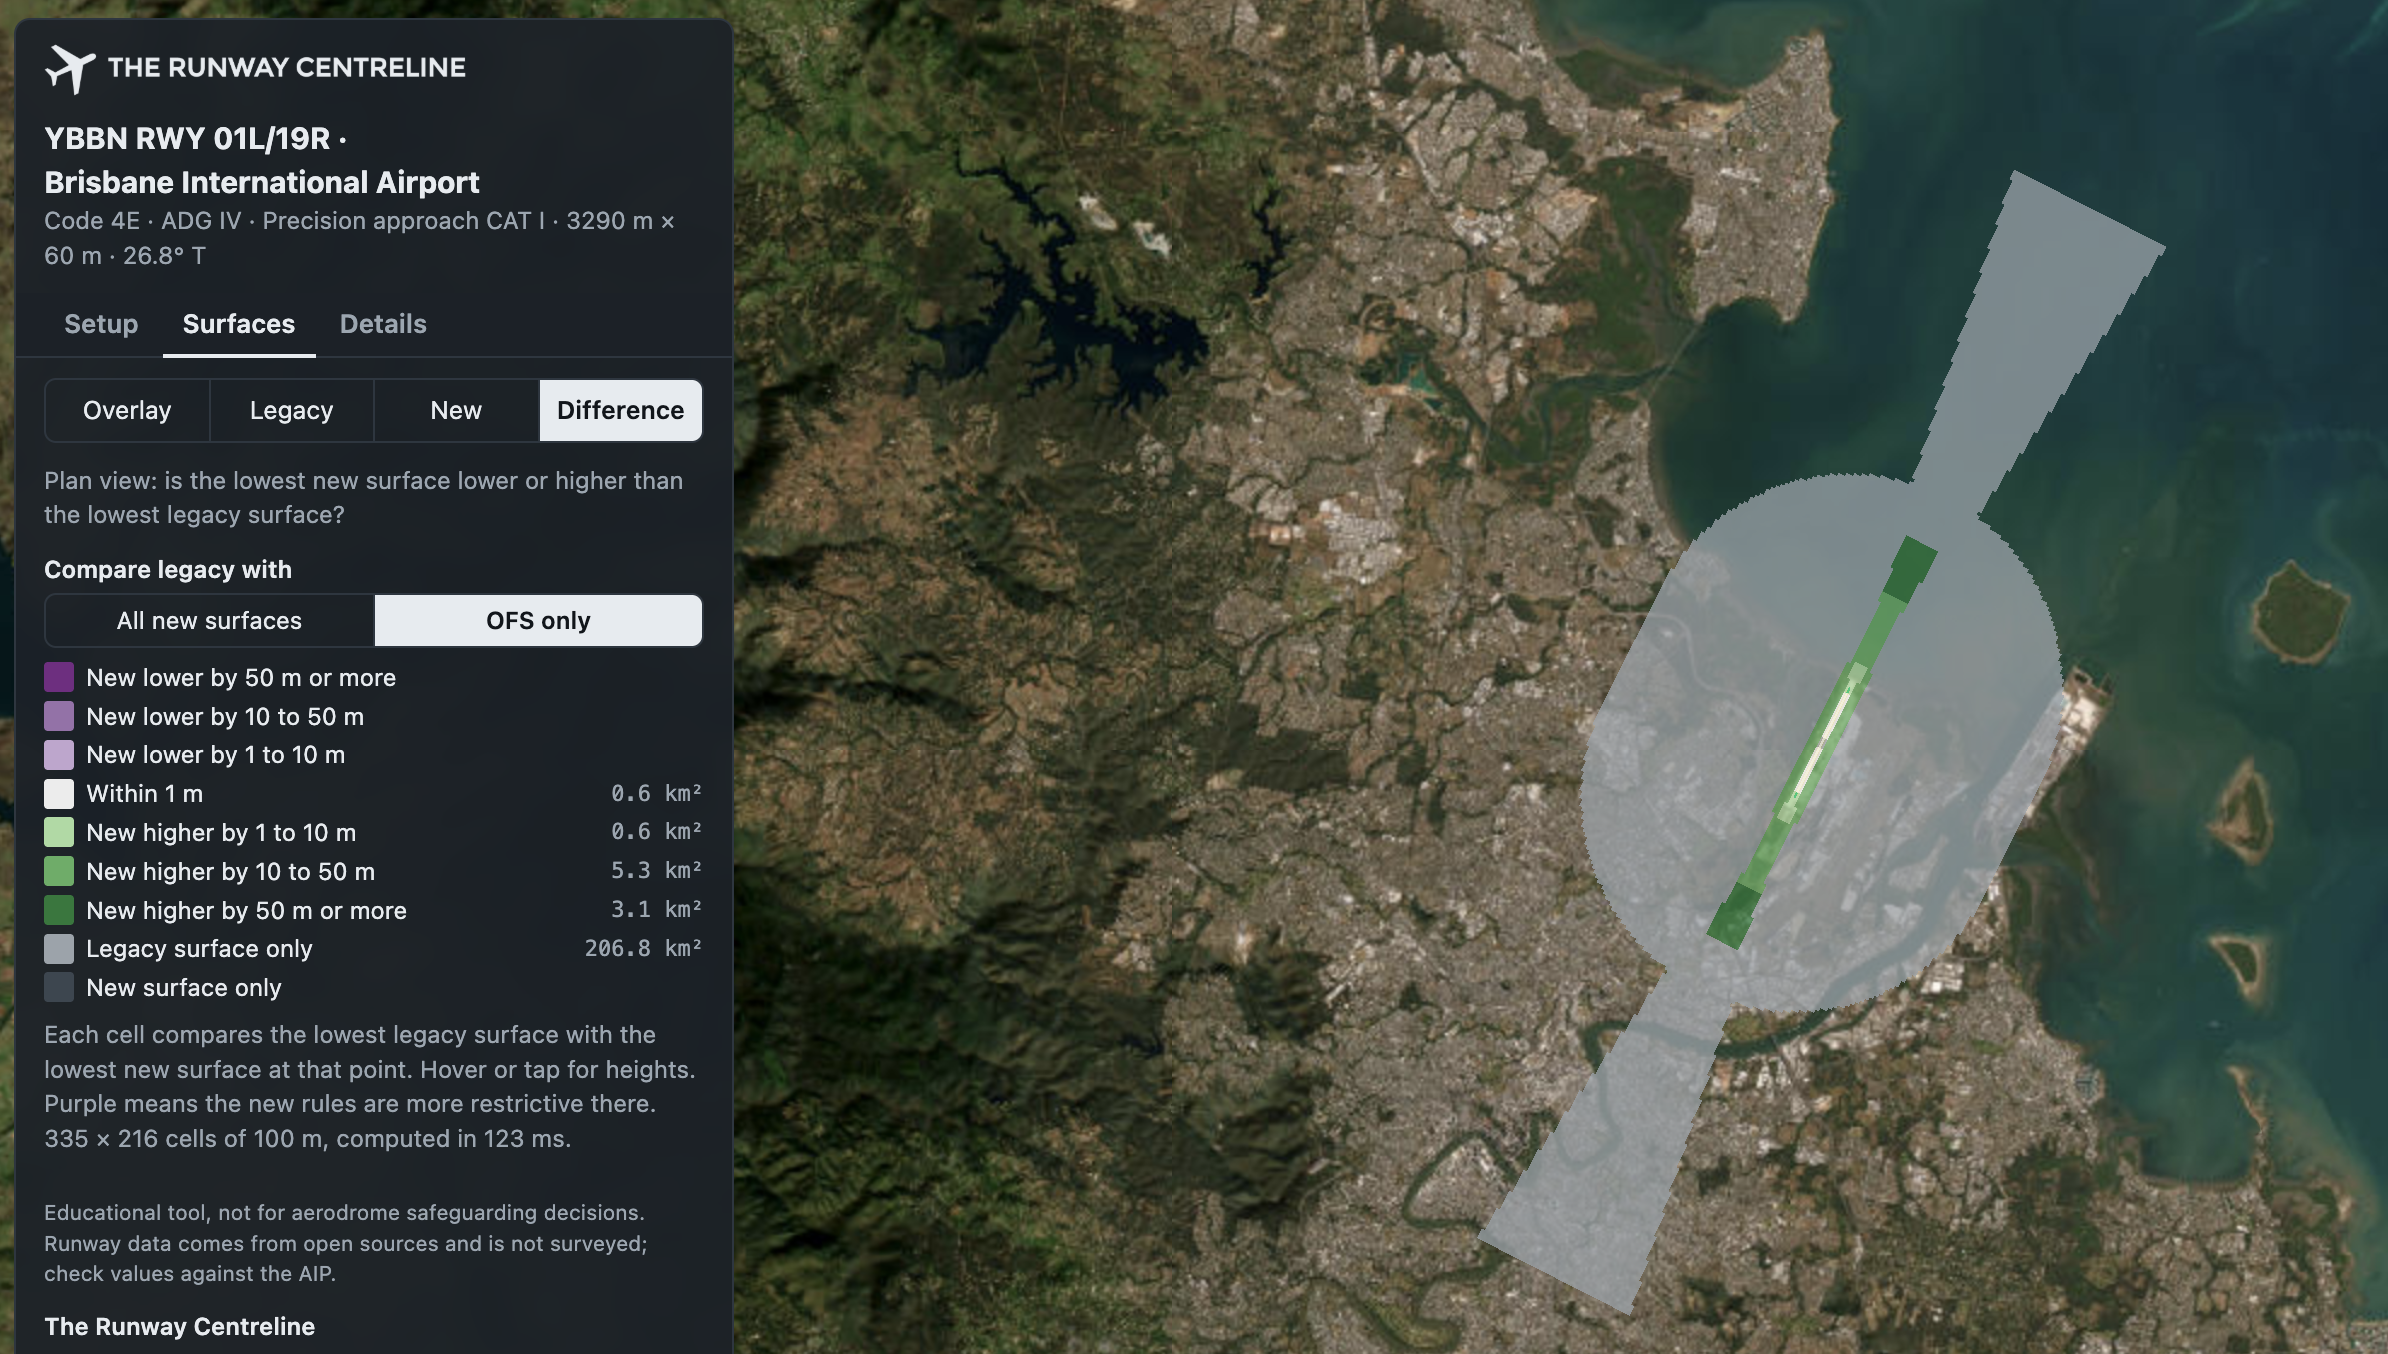
A Word of Caution
This build was an AI-assisted endeavour. I didn’t just prompt the model once and let it rip. I curated the standards it used, walked through a staged development, QA’d the results and provided some independent data to test against. But I need to be explicit about this tool’s purpose…
This is an educational tool. It is not for aerodrome safeguarding decisions. Please don't use it to approve (or object to) a crane.
You may notice some of the following issues:
The runway data isn't surveyed. So some of them don’t line up. At Brisbane, the 01R end sits about 60 m short of the actual pavement. You can override every value, and you should if it matters - for personal education only.
One runway and one critical aeroplane at a time. Both ends share the same approach type, and multiple ADGs are not stacked.
No obstacle penetration checking. The buildings you see are OpenStreetMap context, not obstacle data.
Annex 14 only. No State variations, so no MOS 139 outer horizontal surface.
Some simplifications. The legacy approach goes horizontal at 150 m above threshold (no OCA/H input yet), and the runway profile is a straight line between thresholds.
And there are likely to be some bugs.
What's Next?
There is a lot of room for improvement here: multiple runways shown together, different approach types at each end, stacked horizontal surfaces for mixed ADGs, obstacle penetration checks and State variations like MOS 139. What gets built depends on what people actually find useful.
So please, give it a go at an airport you know well and tell me where it's wrong. Comment below or find me on LinkedIn.
* That is ICAO's applicability date and each country may implement as they deem appropriate
Header credit: Magda Ehlers
