
Fast-Time Simulation: Chaos & Playing God
Last weekend, with the help of ChatGPT, I started learning how to do fast-time simulation in Python. Modelling operations in Excel can be fun, but I wanted to step up my game. And since I don’t have access to any full-featured simulation platforms, I thought I would teach myself how to code this stuff.
This process started with background research and creating a schedule I could use for my simulations. Then I built an airport, its apron management processes and a way of tracking the apron’s performance. This weekend, I am playing God.
In Need of a Purpose
Fast-time simulation is a means to an end. There needs to be a question to answer. A simulation without a purpose (and a cool visualisation) isn’t very useful. My previous activities were aimed at figuring out if I could do this. With the success of those steps, I now need to do something with them.
With the code I had already completed, I could have looked at the impact of the number of parking positions on overflow (or lack of capacity), but I wanted something more interesting. If I was going to subject this airport to punishment day after day, I wanted to manipulate another variable.
Enter, Chaos
In my first post, I introduced randomness into my schedule to create a little variability/unpredictability. I had modified that code slightly in the update, and now I’ve taken it to the next level with a chaos number.
This number affects the actual time of arrival and turnaround time. However, it is pretty rudimentary in its current state as it simply increases the mean and expands the standard deviation of a normal distribution. The higher the chaos number, the greater the variability in the schedule and the greater the likelihood that aircraft will run late.
I would love to include a more realistic model of on-time performance, but I need a little more time to digest this paper.
Simulation Time
Each simulation runs through one day. Firstly, it uses the chaos number to calculate the actual times of arrival for our scheduled flights. After this, it creates an airport log that will track parking position occupancy and the number of aircraft in overflow. Then it runs through the simulation, minute by minute, working out who needs to leave, who has arrived, and where they can park.
Here is a graphical representation of the workflow:
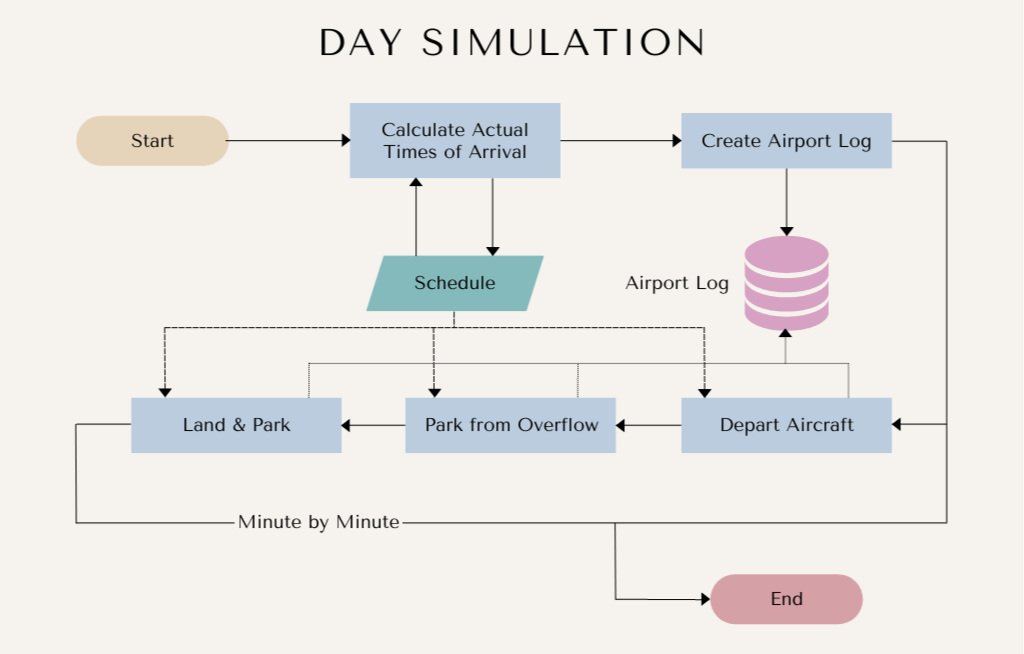
From this simulation, I can calculate mean overflow occupancy and maximum overflow occupancy. I could also calculate parking position usage, on-time performance, and more. But I’m interested in the first two.
Let’s Do That Again, and Again, and Again
So, that was one day. Now I can nest that code within a more extensive multi-day simulation and feed it randomised numbers for the number of stands and chaos. I’ll need a database to capture each simulation’s parameters and performance. This step was surprisingly easy with all my previous coding doing the heavy lifting.
I set the number of bays to a random number between 3 and 10, chaos to between 0 and 15 and the number of days at 1000.
And how long did three years of mean busy days take to simulate?
46 minutes.
Results
Well, it’s early on Saturday morning now and I’ll dive a little more into the best way to visualise the results and how to draw conclusions this evening. Here is a quick viz I did this morning.

The colours represent chaos: red is bad
See you tomorrow.